

Which Australian Bookmaker Has the Best Odds?
Sportsbet led overall. DraftKings led basketball. Pinnacle led soccer. No bookmaker won everywhere.
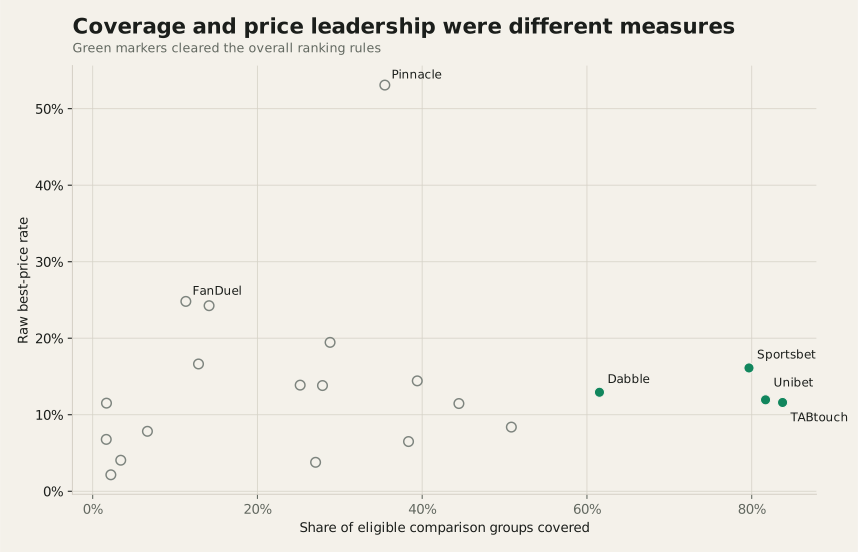
Sportsbet ranked first among the four bookmakers that met every coverage rule. Its equal-sport-weighted best-price rate was 17.7%, ahead of Dabble at 13.3%. The paired event bootstrap put the observed lead between 0.8 and 7.9 percentage points.
That result applies to this short February 2026 sample. It is not a permanent or universal ranking.
- Bookmakers
- 21
- Matched prices
- 24,277
- Events
- 192
- Sports
- 3
Sportsbet led overall
Sportsbet's equal-sport-weighted best-price rate was 17.7%. Dabble followed at 13.3%. The observed lead was 4.4 percentage points, with a paired 95% interval from 0.8 to 7.9 points.
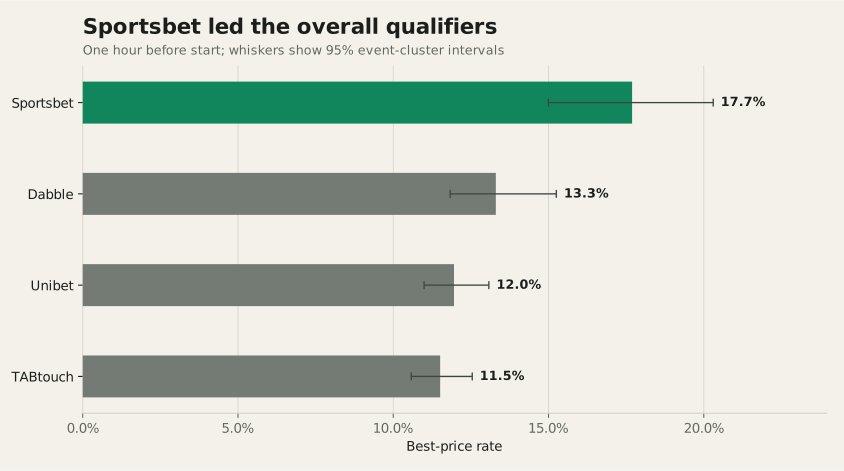
| Rank | Bookmaker | Best-price rate | 95% interval | Coverage | Comparisons |
|---|---|---|---|---|---|
| 1 | Sportsbet | 17.7% | 15.0%–20.3% | 79.7% | 2,853 |
| 2 | Dabble | 13.3% | 11.8%–15.3% | 61.5% | 2,203 |
| 3 | Unibet | 12.0% | 11.0%–13.1% | 81.7% | 2,925 |
| 4 | TABtouch | 11.5% | 10.6%–12.5% | 83.7% | 2,999 |
The ranking measures price leadership, not brand size. A bookmaker could post a strong rate in a narrow slice and still fail the overall coverage rules. Pinnacle did exactly that in a soccer-heavy sample.
Best-price frequency also differs from staying close to the best. Sportsbet and Dabble had similar mean gaps from the market best—3.53% and 3.52%—even though Sportsbet led more often.
The leader changed by sport
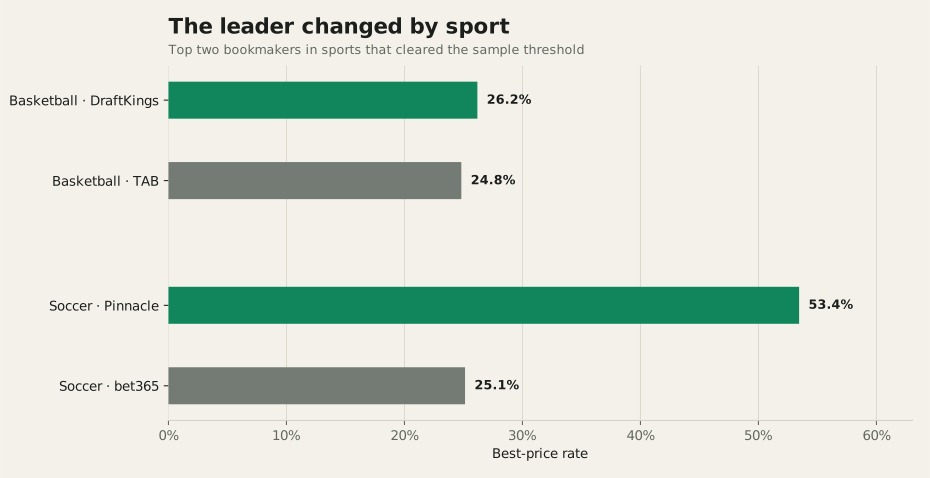
Basketball and soccer produced different winners. Rugby league did not have enough data for a ranking.
| Scope | Observed leader | Best-price rate | Runner-up | Runner-up rate | Leader sample |
|---|---|---|---|---|---|
| Basketball | DraftKings | 26.2% | TAB | 24.8% | 437 comparisons; 19 events |
| NBA subset | DraftKings | 25.1% | bet365 | 23.5% | 350 comparisons; 9 events |
| Soccer | Pinnacle | 53.4% | bet365 | 25.1% | 1,227 comparisons; 102 events |
| Rugby league | No ranking: no bookmaker reached 100 comparisons | Largest sample: 8 comparisons; 3 events | |||
Basketball and NBA
DraftKings led basketball at 26.2%, 1.4 percentage points above TAB. The gap was similarly small in the NBA subset: DraftKings recorded 25.1% across 350 comparisons, while bet365 recorded 23.5% across 364. No paired sport-level confidence interval was calculated, so neither lead should be described as decisive.
Sportsbet covered more basketball groups than DraftKings—76.5% compared with 52.2%—but ranked lower on observed best-price frequency at 20.6%. That trade-off is why coverage and price leadership need separate columns.
Soccer
Pinnacle recorded the highest observed soccer rate at 53.4% and the smallest mean gap from best at 1.17%. It covered 44.8% of eligible soccer groups. The result was also flagged for manual review because the rate was unusually high, and Pinnacle failed the overall ranking because 96.6% of its eligible observations came from one sport.
bet365 ranked second at 25.1%, but its soccer sample contained only 130 comparisons across seven events. The rate difference is large; the coverage difference is also large. Treating the two figures as if they came from identical market breadth would overstate the result.
Rugby league, NRL and AFL
The data does not support a rugby league or NRL winner. The largest bookmaker sample contained eight comparisons across three events, far below the 100-comparison threshold. AFL did not appear with an eligible sample. Any claim naming the best bookmaker for AFL or NRL would be invented, so none is made.
Readers comparing current basketball prices can use the live NBA odds page; the historical result above remains limited to the study period.
Worse odds cut winning payouts
At decimal odds of 2.00, a winning A$100 bet returns A$200. At 1.90, the same selection and stake return A$190. The result is identical; the lower price cuts the gross return by A$10.
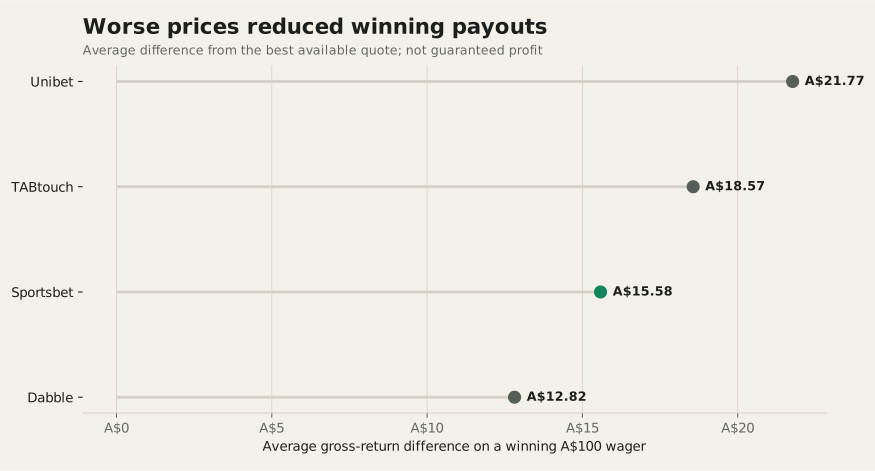
Across this study's eligible bookmaker observations, the market-best quote offered an average A$20.31 more gross return on a winning A$100 wager than the quoted bookmaker price. At a A$50 stake, the directly scaled difference is A$10.16.
| Bookmaker quote used | Average additional return | Median additional return |
|---|---|---|
| Dabble | A$12.82 | A$5.00 |
| Sportsbet | A$15.58 | A$5.00 |
| TABtouch | A$18.57 | A$5.00 |
| Unibet | A$21.77 | A$5.00 |
These figures describe winning payouts only. The study did not model selections, results, staking, win probability or account limits. It therefore cannot estimate realised profit over 100, 500 or 1,000 ordinary bets without adding unsupported assumptions.
Better prices can improve expected value when every other input is equal. The expected value guide explains that distinction, while the odds calculator converts decimal prices into implied probabilities.
No bookmaker won everywhere
Sportsbet's overall result does not mean it led every market. The winner changed by sport, market type and coverage. Even Sportsbet's 17.7% rate means it did not hold the highest price in most eligible comparisons.
Prices moved before start
Coverage changed the meaning of rank
A specialist bookmaker can look strong in the markets it carries while being absent from most comparisons. A broad bookmaker may appear more often but lead less frequently.
How we compared the odds
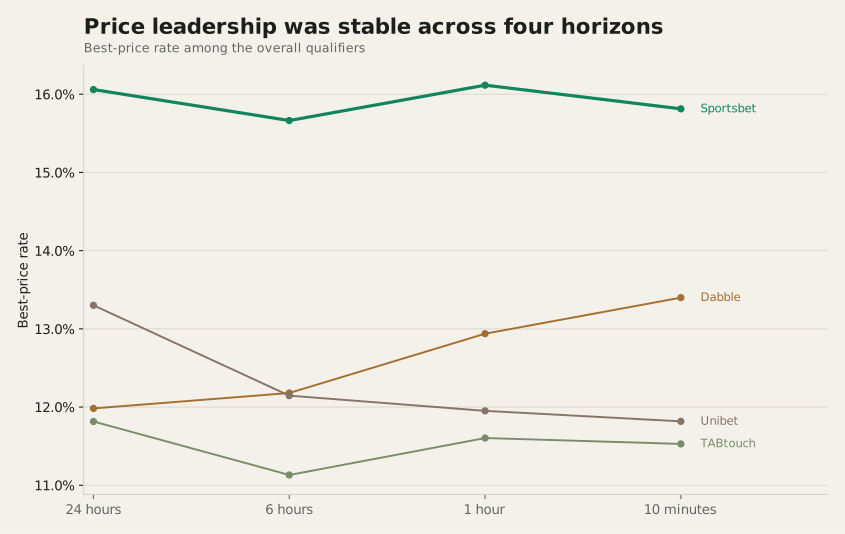
The headline ranking uses bookmaker prices recorded one hour before scheduled start. We also checked prices at 24 hours, six hours and 10 minutes to see whether the leader changed.
Every comparison matched the same event, market, selection and exact handicap or total line. Each group needed at least five bookmakers. Brisbane +6.5 was never compared with Brisbane +7.5, and repeated unchanged updates did not count as new observations.
Method at a glance
- Eligible events
- 17–22 February 2026
- Recorded ticks
- 17–18 February 2026 UTC
- Markets
- Full-time moneyline, handicap and totals
- Best-price ties
- Fractional credit: 0.5 each in a two-way tie
- Uncertainty
- 1,000 event-cluster bootstrap samples; 95% intervals
- Overall qualification
- 1,000 comparisons, two sports, 50 events, 10% coverage and concentration caps
The source audit covered 1.039 billion semantic price-change rows across 25 bookmaker names. That is not the comparison count. After matching and quality rules, the study used 24,277 eligible bookmaker observations from 21 bookmakers.
Live betting, racing, player props, same-game multis, futures, outrights, unavailable prices and post-start records were excluded. Non-standard metrics were removed, and extreme price differences were sent to quality review.
Why we did not rank vig
The data cannot support a lowest-vig winner. Vig is the bookmaker's margin across every outcome in a market. A defensible comparison needs the complete set of prices captured at the same moment.
The aggregate output keeps selection-level prices and comparison metrics, not every simultaneous outcome set needed for an overround table. Best-price rate, gap from best and payout difference are not substitutes for vig.
Low vig and the highest price are also different measures. A bookmaker can run a tighter market overall while another offers the better price on the selection you want.
What this study cannot prove
- The materialised ticks cover 17–18 February 2026 UTC and eligible events from 17–22 February. This is not a season-long ranking.
- Only basketball, soccer and a small rugby league sample survived the rules. The data cannot name an AFL or NRL winner.
- The study covers pre-match moneyline, handicap and totals. It excludes live odds, racing, props, futures, outrights and same-game multis.
- Coverage was uneven. Qualification and concentration rules reduce that bias but cannot remove it.
- Displayed prices can differ from accepted prices. Stake limits, account restrictions, geography, void markets and bet acceptance sit outside the data.
- No outcomes or win probabilities were modelled. The study does not claim historical profit or identify the lowest-vig bookmaker.
Download the data
The analysis used WagerWise's canonical semantic odds-tick table and existing event, market and selection identifiers. Repeated unchanged scrapes did not count as separate observations. A deterministic 200-group QA sample checked exact matching, lines, timing and bookmaker uniqueness.
- Best-price rate
- Fractional best-price credit divided by eligible comparison groups containing that bookmaker.
- Gap from best
- One minus the bookmaker price divided by the highest price in the exact group. Lower is better.
- Coverage
- The share of eligible comparison groups in which the bookmaker appeared.
- Additional return
- A$100 multiplied by the difference between the best decimal odds and the bookmaker's decimal odds.
Source: WagerWise bookmaker odds research pipeline. Analysis generated 21 July 2026; article published 22 July 2026. Percentages are rounded to one decimal place in prose and tables.
Use the result this way
- Compare the exact same event, selection and line before placing a bet.
- Judge a bookmaker by the sports and markets you use, not the overall rank alone.
- Recheck the price close to placement. Odds move, and no bookmaker led every comparison.
Use the WagerWise odds comparison screen to compare current prices. The positive EV tools and arbitrage guide explain related strategies.
Questions bettors ask
Which Australian bookmaker has the best odds?
Sportsbet ranked first among the four broad-coverage qualifiers in this observed sample. Its equal-sport-weighted best-price rate was 17.7%, compared with 13.3% for Dabble. The result does not mean Sportsbet led every sport, market or event.
Which bookmaker had the lowest vig?
The study cannot identify one. It compared selection prices but did not preserve the complete simultaneous outcome sets required for a defensible overround calculation.
Which bookmaker had the best NBA odds?
DraftKings ranked first in the observed NBA subset at 25.1% across 350 comparisons. bet365 followed at 23.5% across 364 comparisons. The difference was small and no paired NBA confidence interval was calculated.
Which bookmaker had the best NRL odds?
No winner was named. No rugby league bookmaker reached the 100-comparison threshold; the largest sample contained eight comparisons across three events.
How much difference do better odds make?
Across eligible observations, the market-best quote offered an average A$20.31 more gross return on a winning A$100 wager. This is a payout difference, not guaranteed profit.
Is the bookmaker with the lowest vig always best?
No. Low vig describes the margin across all outcomes. Another bookmaker can still post the highest price for one selection. The two measures answer different questions.
Compare the price, not the logo
Sportsbet led this sample, but no bookmaker held the best price often enough to justify loyalty on price alone.
Compare the same event, selection and line across bookmakers. That is still the clearest way to find the strongest available odds.
Compare bookmaker odds